
Introduction: From Chaos to Clarity
Projects are complex. They’re filled with overlapping timelines, shifting priorities, and a mountain of sticky notes that no one remembers writing. Whether you’re building a product, launching a website, or just trying to finish that research paper, complexity creeps in fast—because every project is a moving n-dimensional puzzle.
One of a project manager’s main jobs is to keep this puzzle in order, and one of the best tools for that is the Work Breakdown Structure (WBS). A WBS breaks down a project into smaller, manageable chunks, each one easier to plan, delegate, and execute. You can imagine it as the family tree of projects: from the high-level objective to the nitty-gritty tasks.
For example, a WBS for launching a product might look like:

Each element can be further broken down into tasks or sub-objects like ‘Concept Design’, ‘Prototype’, or ‘Packaging’. This “divide and conquer” approach creates systems that are simple, structured, and far less panic-inducing.
But here’s the catch: building and maintaining a good WBS often takes time, and many project management tools either lack proper support or lock you into rigid templates.
This is where Obsidian steps in with its Graph View.
For many, the Graph is the visual hook that gets them curious about markdown-based knowledge management and for good reasons. It offers:
- A visual overview of your notes and their connections
- Aesthetic appeal, making note exploration enjoyable
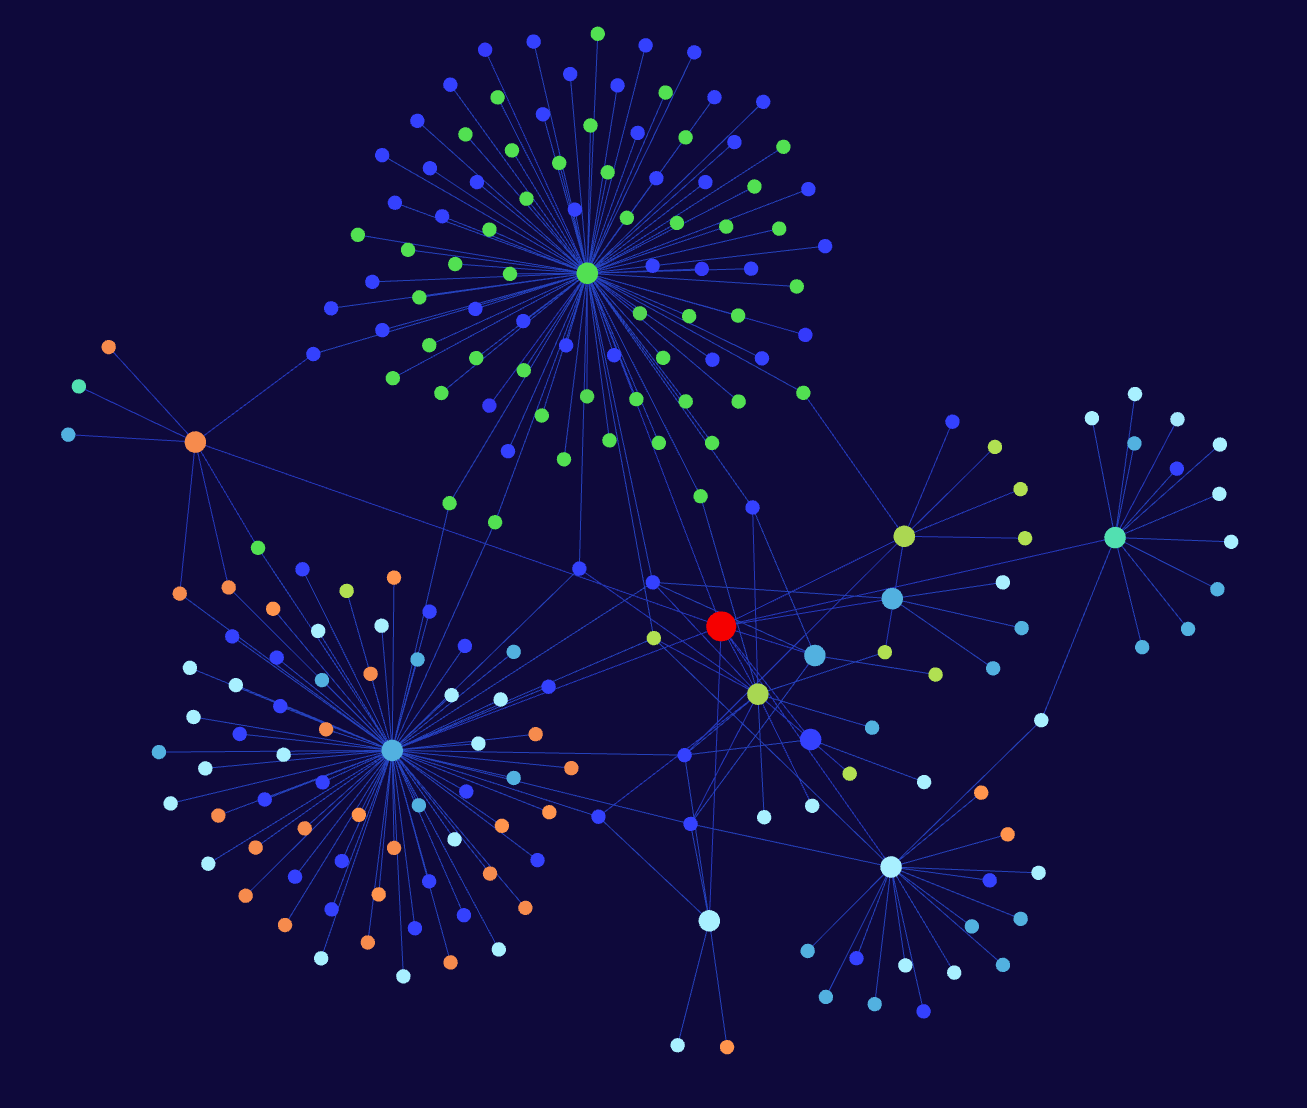
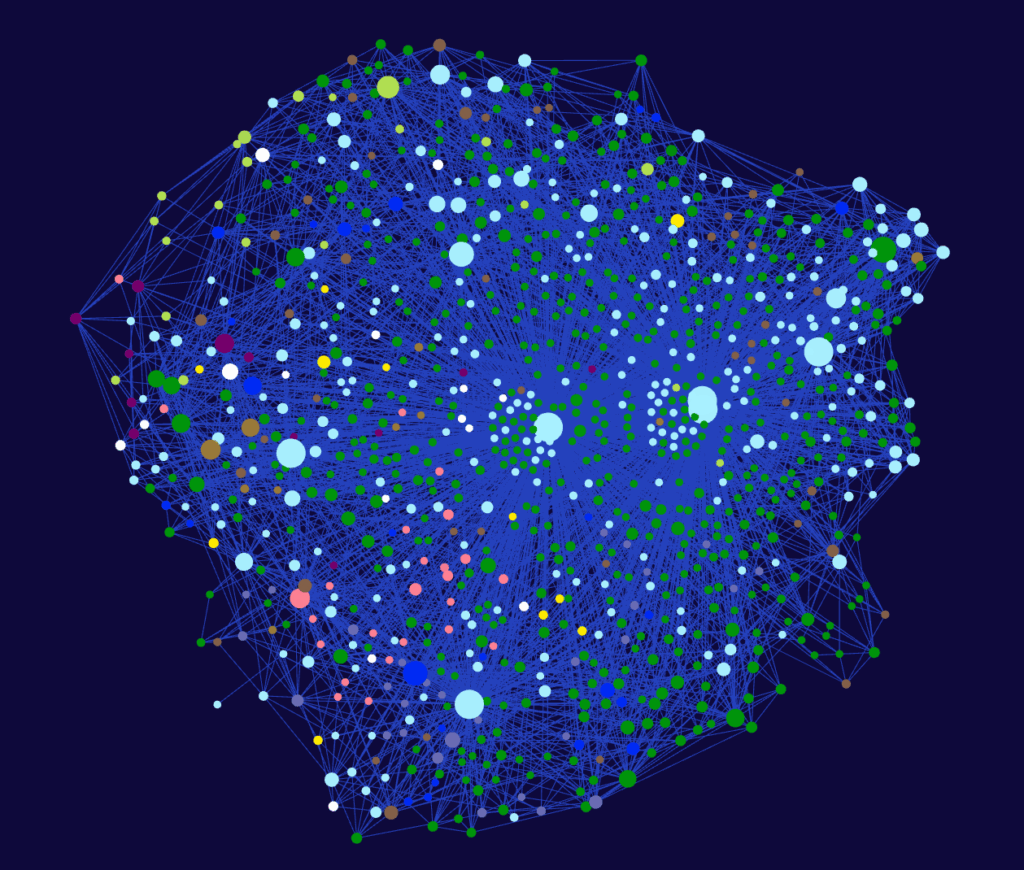
And it does look beautiful. But the moment your vault outgrows the first 100 notes and you get serious about linking, the graph becomes a jittery cloud of dots and lines, that is more a reminder of a Jackson Pollock than any project plan.
But with the help of a few light metadata conventions and filters, this chaos can be tamed. In fact, the graph can be turned into a scalable, filterable WBS that stays readable even as your projects spiral into delightful complexity.
Setting up a WBS in Obsidian’s Graph View
Requirements & Strategy
There are many ways to create structure in Obsidian: tags, folders, links, metadata. For building a WBS, I chose a combination of YAML frontmatter metadata and note links, because:
- Links are easily recognizable and navigable
- They integrate well with the graph engine
- They’re intuitive for note-based thinking
- They can be easily changed later on without plugins or coding
- Each link points to a note where I can document its meaning or role—like whether it represents a dependency, a location, or a stakeholder
- Obsidian natively offers backlinks, which also act as a prefiltered search layer
Tags are history—the “Age of Links” is upon us.
The context Property
The core of the system is a YAML property called context, which I include in nearly every note in my vault to establish a clear parent-child relationship between notes. A note can have multiple contexts representing its project, category, or folder.
Example:
context:
  - "[[PRJT 03]]"
  - "[[Charging Infrastructure]]"
This context shows that the note belongs to PRJT 03 and within the project to charging infrastructure that is being realized within the project.
This simple structure allows the note to be a part of both the “PRJT 03” project and the “Charging Infrastructure” category without the need for unnecessary folders.
Dimensions
Another category type I use are so called Dimension Notes (short DIM). They’re another layer of structure, linked via the context property, that help narrow focus and enhance filtering. Unlike categories, DIM notes are dynamically applied depending on the project or note status.
Possible dimensions are:
[[DIM focus]]: What I need to concentrate on now[[DIM plan]]: Steps necessary for the current plan – think of it as a slice out of multi year projects[[DIM critical]]: Elements of the critical path
This makes the structure highly filterable and multi-perspective, without cluttering or duplicating content.
Filtering the Graph from Chaos to Clarity
Then, in the Graph View, I can apply filters like:
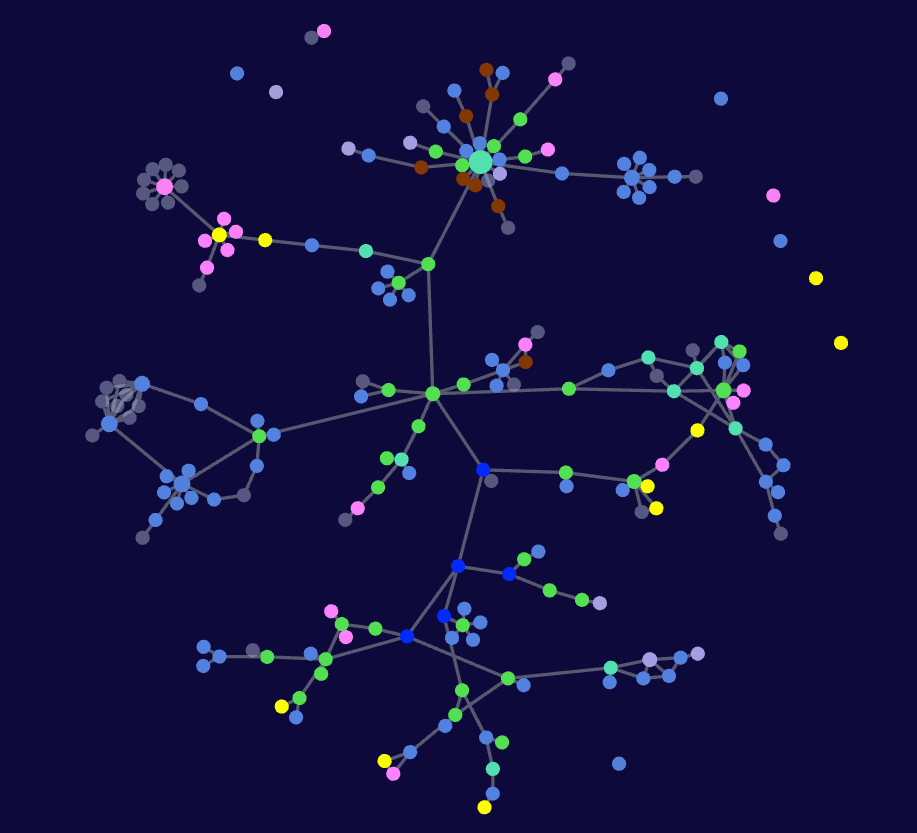
[context:"PRJT 03"] [context:"Charging Infrastructure"]…turning this:
…into this.
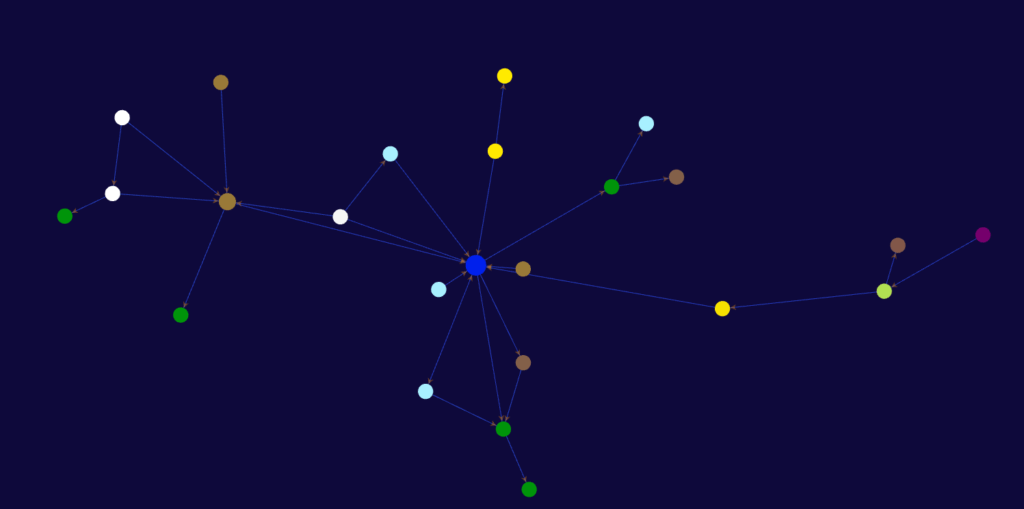
…and instantly isolate just those notes that belong to both categories. The result is a crisp, navigable project-slice that allows me to:
- Retain a birds-eye view
- Identify missing links or gaps
- Spot bottlenecks or risks
- Always have an overview available for presentations or team meetings
Check out Obsidian’s search documentation for more filtering options.
Since I can also interact with the nodes to open them in another tab or a Hover Editor I have a 2D explorer at the ready.
This approach scales effortlessly. I can use categories like locations, positions, asset-types, or project paths to further filter or group notes.
Speaking of grouping, you can also use the Graph-Views Grouping-Feature to visualize note status or categories—again using properties, links, or tags to keep things both simple and dynamic.
Outro – Final Thoughts
By combining…
- Note links
- YAML frontmatter (
context) - Dimension filters
…Obsidian’s Graph View becomes much more than a pretty picture. It becomes a functional WBS engine. It scales with complexity while remaining human-readable and structurally flexible.
This setup is particularly powerful in knowledge-heavy, iterative, or non-linear project environments where traditional Gantt charts fall short.
If you’re already using Obsidian, give this method a try and watch your notes organize themselves into insight.
Leave a Reply