
The Delicate Art of Not Drowning in Timeline Versions
As any project manager knows, creating a good Gantt chart is only half the battle. The other half? Keeping it updated, in sync, and tailored to the whims of various stakeholders. Upper management wants birds-eye views. Your development team demands specificity. And you, dear PM, want to spend less time updating charts and more time actually managing the project.
In our previous article, we explored how to build Gantt charts manually using Mermaid syntax in Obsidian. Like a bonsai tree it was clean, beautiful and to a large part hand crafted. But like a bonsai tree, it requires trimming. Constantly.
Because it is never just one chart. There is one for you, another for your boss, a third for that curious stakeholder, who insists on weekly updates, and let’s not forget the team. And that is just the basis because if project management taught me one thing it is that “planning replaces chance with error” (“Planung ersetzt Zufall durch Irrtum”) [Nef 1973].
Start dates shift, durations change, tasks split, combine, or are postponed. And every time each chart must be revisited, adjusted, and quality-checked — manually. Soon, your masterpiece risks becoming a Zeitfresser — a time-eater.
What began as a tool for clarity becomes a treadmill of edits and soon you’re not managing a project; you’re managing versions of timelines.
But what if the chart could grow itself? What if you had the right graph at the ready every time you need it regardless of the target audience?
Obsidian, with a combination of Dataview and Mermaid, makes just that possible: Gantt charts that automatically update themselves whenever object-information changes, and that only show the info you want them to show. No more duplicate timelines, no more manual updates across stakeholder versions or different data versions. Only one single source of truth.
What is Dataview?
Dataview is a powerful Obsidian plugin that turns your markdown notes into a queryable database. It lets you collect and transform metadata from across your vault.
What is Mermaid?
Mermaid, as introduced in the previous article, is a markdown-friendly syntax for creating flowcharts, sequence diagrams, and of course: Gantt charts. If you need a refresher or want to dive deeper, check out the official Mermaid documentation.
Now, let’s combine both.
A Living, Breathing Gantt Chart
Below is the full DataviewJS code for a self-updating Gantt chart that reads from your project notes.
```dataviewjs
// Mermaid Gantt configuration
const mermaidConf = `gantt
    dateFormat  YYYY-MM-DD
    excludes    weekends
    axisFormat  %m
    tickInterval 1month
    title Project Plan
    todaymarker on`;

// Get all relevant pages (that are #object, link to others, and not marked as #object/project)
const pages = dv.pages('#object AND outgoing([[]]) AND !#object/project')
    .where(p => p.start || (typeof p.start === 'string' && p.start.startsWith('[[')));

// Helper: Parse legacy duration strings like "2w", "3mo" into objects
function parseDuration(str) {
    const num = parseInt(str);
    const unit = str.slice(-1);
    switch (unit) {
        case 'd': return { days: num };
        case 'w': return { weeks: num };
        case 'm': return { months: num };
        case 'y': return { years: num };
        default: return { days: 0 };
    }
}

// Helper: Parse ISO 8601 strings like "P1M1W" into objects
function parseISODuration(iso) {
    const match = iso.match(/^P(?:(\d+)Y)?(?:(\d+)M)?(?:(\d+)W)?(?:(\d+)D)?$/);
    if (!match) return null;
    const [, y, m, w, d] = match.map(x => (x ? parseInt(x) : 0));
    return {
        ...(y ? { years: y } : {}),
        ...(m ? { months: m } : {}),
        ...(w ? { weeks: w } : {}),
        ...(d ? { days: d } : {})
    };
}

// Helper: Recursively resolve links to other pages using condition (start/end)
function resolveLinkedDate(value, condition, fallbackDate = dv.date('today'), visited = new Set()) {
    if (!value) return fallbackDate.toISODate();
    const preferStart = condition === 'start';
    const preferEnd = condition === 'end';

    const resolvePageName = (val) => {
        if (val?.path) return val.path;
        if (typeof val === 'string' && val.startsWith('[[')) {
            return val.replace(/\[\[|\]\]/g, '');
        }
        return null;
    };

    const path = resolvePageName(value);
    if (path && visited.has(path)) return fallbackDate.toISODate();
    if (path) visited.add(path);

    if (path) {
        const linked = dv.page(path);
        if (linked) {
            if (preferEnd) return resolveEndInfo(linked).end;
            if (preferStart) return resolveLinkedDate(linked.start, linked.start_condition, fallbackDate, visited);
            return resolveLinkedDate(linked.end ?? linked.start, linked.end_condition ?? linked.start_condition, fallbackDate, visited);
        }
    }

    if (value?.toISODate) return value.toISODate();
    return fallbackDate.toISODate();
}

// Resolve the start date for a task
function resolveStartDate(task, fallback = dv.date('today')) {
    return resolveLinkedDate(task.start, task.start_condition, fallback);
}

// Resolve the end date or duration of a task
function resolveEndInfo(task) {
    const raw = task.end;
    const startDate = resolveStartDate(task);

    const adjustIfEqual = (end) => end === startDate ? dv.date(end).plus({ days: 1 }).toISODate() : end;

    if (
        typeof raw === 'object' &&
        raw !== null &&
        typeof raw.toString === 'function' &&
        raw.toString().startsWith('P') &&
        !raw.toString().startsWith('PT')
    ) {
        const parsed = parseISODuration(raw.toString());
        if (parsed) {
            const end = dv.date(startDate).plus(parsed).toISODate();
            return { end: adjustIfEqual(end) };
        }
    }

    if (raw?.toISODate) {
        const end = raw.toISODate();
        return { end: adjustIfEqual(end) };
    }

    if (typeof raw === 'string' && /^[0-9]+[dwmy]$/.test(raw.trim())) {
        const parsed = parseDuration(raw.trim());
        const end = dv.date(startDate).plus(parsed).toISODate();
        return { end: adjustIfEqual(end) };
    }

    if (raw?.path) {
        const linked = dv.page(raw.path);
        if (linked?.end?.toISODate) {
            const end = linked.end.toISODate();
            return { end: adjustIfEqual(end) };
        }
        if (linked?.duration) {
            const linkedStart = resolveStartDate(linked);
            const end = dv.date(linkedStart).plus(parseDuration(linked.duration)).toISODate();
            return { end: adjustIfEqual(end) };
        }
    }

    if (typeof raw === 'string' && raw.startsWith('[[')) {
        const linkedName = raw.replace(/\[\[|\]\]/g, '');
        const linked = dv.page(linkedName);
        if (linked?.end?.toISODate) {
            const end = linked.end.toISODate();
            return { end: adjustIfEqual(end) };
        }
        if (linked?.duration) {
            const linkedStart = resolveStartDate(linked);
            const end = dv.date(linkedStart).plus(parseDuration(linked.duration)).toISODate();
            return { end: adjustIfEqual(end) };
        }
    }

    const fallbackEnd = dv.date(startDate).plus({ days: 1 }).toISODate();
    return { end: fallbackEnd };
}

// Prepare Mermaid Gantt sections and debug info
let mermaidSections = [];
let debugRows = [];

for (let group of pages.groupBy(p => p.section ?? 'Allgemein')) {
    const sortedTasks = group.rows
        .sort((a, b) => new Date(resolveStartDate(a)) - new Date(resolveStartDate(b)))
        .map(p => {
            const startDate = resolveStartDate(p);
            const raw = p.end;
            const type = typeof raw;
            let interpretation = '';

            if (raw?.toISODate) {
                interpretation = 'Date object';
            } else if (raw?.toString?.().startsWith?.('P')) {
                interpretation = 'ISO duration object: ' + raw.toString();
            } else if (typeof raw === 'string' && /^[0-9]+[dwmy]$/.test(raw.trim())) {
                interpretation = 'Duration string';
            } else if (raw?.path || (typeof raw === 'string' && raw.startsWith('[['))) {
                interpretation = 'Link to another note';
            } else {
                interpretation = 'Unrecognized';
            }

            const { end } = resolveEndInfo(p);

            debugRows.push({
                name: p.file.name,
                ID: p.ID ?? '',
                status: p.status ?? '',
                start: startDate,
                end: end,
                end_type: type,
                end_raw: raw,
                interpreted_as: interpretation
            });

            return `${p.file.name} : ${p.status ?? 'done'}, ${p.ID ?? 'id_' + p.file.name}, ${startDate}, ${end}`;
        });

    if (sortedTasks.length > 0) {
        mermaidSections.push(`section ${group.key}\n${sortedTasks.join("\n")}`);
    }
}

// Optional debug table – uncomment to enable
/*
if (debugRows.length > 0) {
    dv.table(
        ["Name", "ID", "Status", "Start", "End", "Type of end", "Raw end", "Interpreted as"],
        debugRows.map(r => [
            r.name,
            r.ID,
            r.status,
            r.start,
            r.end,
            r.end_type,
            typeof r.end_raw === 'object' ? r.end_raw.toString() : String(r.end_raw),
            r.interpreted_as
        ])
    );
}
*/

// Output the final Mermaid Gantt diagram
const mermaidBlock = "```mermaid\n" + mermaidConf + "\n" + mermaidSections.join("\n") + "\n```";
dv.paragraph(mermaidBlock);

```
Understanding the Query
The DataviewJS query is designed to gather all notes that:
- Are tagged with
#object - Are not tagged as
#object/project - Are linked from the file containing this DataviewJS code block
This makes it easy to build focused Gantt charts by simply linking the relevant task files in the chart note.
Of course, you can adapt this filter to your own needs. Want to include only tasks with a certain tag? Filter by date? Use folders instead of links? The query is yours to shape.
File Requirements
To make this work, each work package (or task note) should contain the following (inline) properties:
- `ID::` Unique identifier for use in Mermaid. Optional, but recommended.
- `section::` The section in which the task should appear.
- `status::` Can be `active`, `crit`, `done`, etc. This determines styling.
- `start::` A start date or link to another file.
- `start_condition::` `start` or `end` — determines which date to extract when linking to another file.
- `end::` An end date, duration (`2w`, `1m`, `P1M1W`, etc.), or a link to another file.
- `end_condition::` Same as `start_condition`, but for end dates.
Example Task Note
Here’s what a simple task note might look like:
AP1.md
ID:: AP1
section:: Section 1
status:: done
start:: 2025-04-30
end:: 2025-05-15
AP2.md
ID:: AP2
section:: Section 1
status:: active
start:: [[AP1]]
start_condition:: end
end:: 2w
You can also link start and end to other notes and pull in their start or end dates dynamically.
Behind the Curtain: What the Code Does
The DataviewJS code scans for relevant files and:
- Resolves
startandendbased on direct values or linked notes. Yes, other notes can be referenced and through start_condition or end_condition you are able to set the start / end date to the respective dates in the linked notes. The algorithm works recursively, so links of links are possible. - Converts durations like
2wor1mointo concrete dates. - Automatically groups tasks into sections.
- Outputs a ready-to-render Mermaid code block.
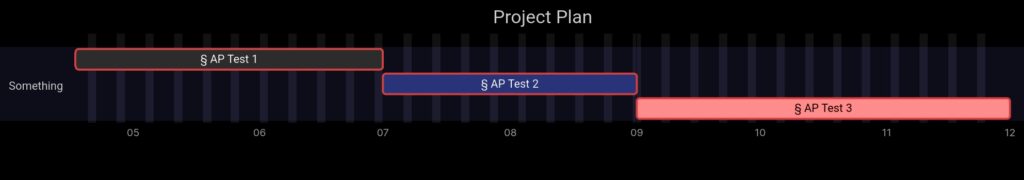
The Result
A Gantt chart that updates itself as your project progresses, new tasks are added, and timelines shift. It saves time, reduces errors, and scales effortlessly across projects and teams.
Using the DataviewJS Block
Just copy the DataviewJS code into a note. As long as you have notes in your vault that meet the search- and property-requirements the gantt chart will automatically be generated.
Outro – Work Smarter, Not Harder
This automation setup drastically reduced the time I spent updating charts, preparing reports, and syncing timelines with team members. And all that while increasing the clarity and quality of my project management.
No more Zeitfresser. Just good, clean, evolving documentation.
Sources
| Key | Citation |
|---|---|
| Nef 1973 | Nef, Robert. Planung ersetzt Zufall durch Irrtum. 1973. |
Leave a Reply