
As project managers, one of our key responsibilities is to maintain a clear overview of time constraints. Deadlines, milestones, dependencies — they all form a complex web that can easily overwhelm even seasoned professionals. Gantt charts have become the preferred method for many to visualize the flow of deliverables across a project’s timeline. They offer a straightforward, visual structure where tasks are mapped against time, making dependencies and critical paths immediately visible.
In Obsidian, a tool praised for its flexibility and customizability, we can integrate Gantt charts seamlessly using Mermaid, a markdown-friendly diagramming syntax. This allows us to keep all project-related documentation and timeline visualization in one place.
A Personal Story: When a Timeline Saved a Project
A few years ago, I was managing a small cross-functional team for a smart district development. As deadlines approached, the list of remaining tasks grew longer and more chaotic. Meetings became frequent but unproductive; we often missed critical dependencies simply because they weren’t visible.
In a moment of frustration, I decided to map out the entire project in a simple Gantt chart — manually, using just a few notes and a whiteboard. Within an hour, everyone could see the real situation: two features that seemed independent were actually tightly coupled, and the timeline we had assumed was achievable was, in fact, already slipping.
The clarity that single chart provided changed the course of the project. We reprioritized, shuffled resources, and ultimately delivered on time. Since then, no project of mine moves forward without a Gantt chart in some form.
How to Create a Gantt Chart in Obsidian with Mermaid
Creating a timeline visualization inside Obsidian is straightforward thanks to the built-in support for Mermaid gantt charts (no plugins needed). Here is an example of a simple Gantt chart you can embed directly into your notes.
Example Mermaid Code:
```mermaid

gantt
    dateFormat   YYYY-MM-DD
    axisFormat   %b-%y
    tickInterval 1month
    title        Titel

section Section 1
AP1 : crit, done, AP1, 2024-08-12, 2024-08-16
AP2 : crit, done, AP2, after AP1, 2w
AP3 : crit, active, AP3, after AP2, 4w

section Section 2
AP4 : crit, AP4, after AP3, 12w
AP5 : crit, AP5, after AP4, 2w


```
What This Code Does
dateFormat sets the format you will use for your dates.
axisFormat defines how dates appear on the timeline axis.
tickInterval specifies the distance between major grid lines (in this case, 1 month).
title is the title of your Gantt chart.
sections group related tasks visually.
Each task has attributes like crit (critical), done (completed), and active (currently worked on), as well as dependencies (e.g. after AP1).
Once this code is added to a markdown file in Obsidian, the Gantt chart will render automatically, giving you and your team a clear project overview.
What it looks like
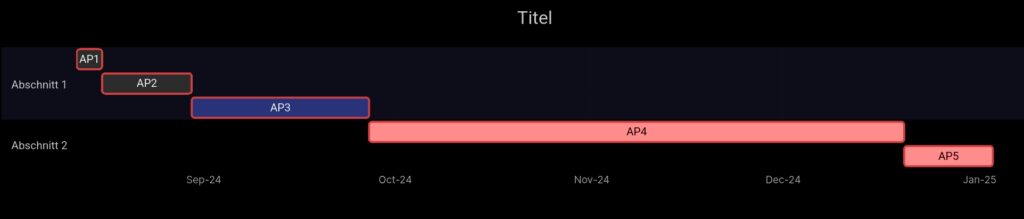
Through screen capture, the gantt chart can easily be inserted into documents or presentation to share it with the team and other stakeholders.
Conclusion
Visualizing your project timeline is not a luxury; it is essential for maintaining momentum and clarity. With Obsidian and Mermaid, you can keep your project documentation and your timeline visualizations in the same system — connected, versioned, and easily adjustable as the project evolves.
Start with a simple Gantt chart, and you’ll be surprised at how quickly your project’s path becomes clear.
Leave a Reply